Dashboard

Data driven decisions with Dashboard
You can do this with Dashboard
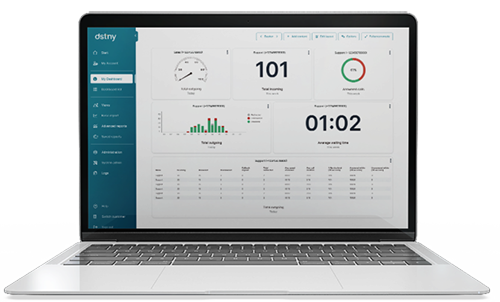
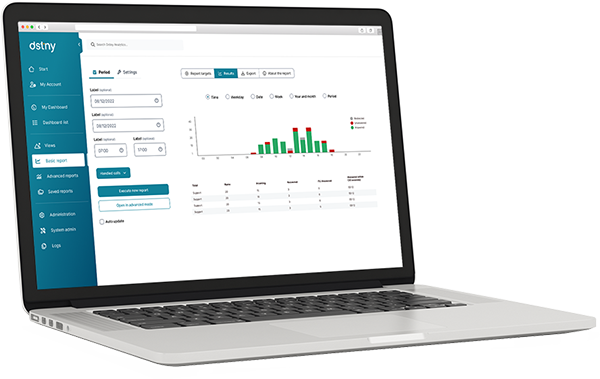
So how can Dashboard help your company? With the service you can see important information regarding your ACD groups that will help you in decision making. You can see how many agents are logged in, which agents are logged in, how many calls are received, how many calls are missed, and so on. You can see both real-time data and gathered data from, for example, the entire past month. In addition, you can choose whether you want to show one or more response groups in the view. Everything on an easy-to-understand interface.

Choose for yourself what to display
The service is very easy to set up according what information you want to see. Through a few simple clicks you can choose whether you want to see one or more response groups. After that, select which information you want to show. You can choose from things like number of calls in queue, average queue time, number of calls received, number of missed calls, etc. Of course you can change the settings or add more information at any time.

Show statistics in a way that is easy-to-read
Get full control with alerts
Show Dashboard on any device
Agent list
Frequently asked questions about Dashboard
Yes, the service is available in English, Swedish, Norwegian, Danish, Finnish, German, Italian, Spanish, Latvian, Estonian, Dutch and French.